On-chain data shows the Bitcoin long-term holder supply has continued declining recently. Here’s what this could mean for the asset.
Bitcoin Long-Term Holder Supply 30-Day Change Has Been Negative Recently
As explained by CryptoQuant author Axel Adler Jr in a post on X, the BTC long-term holder supply hasn’t been showing any signs of growth recently. The “long-term holders” (LTHs) refer to the Bitcoin investors who have held onto their coins for over 155 days.
The LTHs comprise one of the two main divisions of the BTC market based on holding time, with the other cohorts being known as the “short-term holders” (STHs).
Statistically, the longer an investor holds onto their coins, the less likely they become to sell them at any point. As such, the LTHs are considered the stubborn part of the sector, while the STHs include the fickle-minded investors.
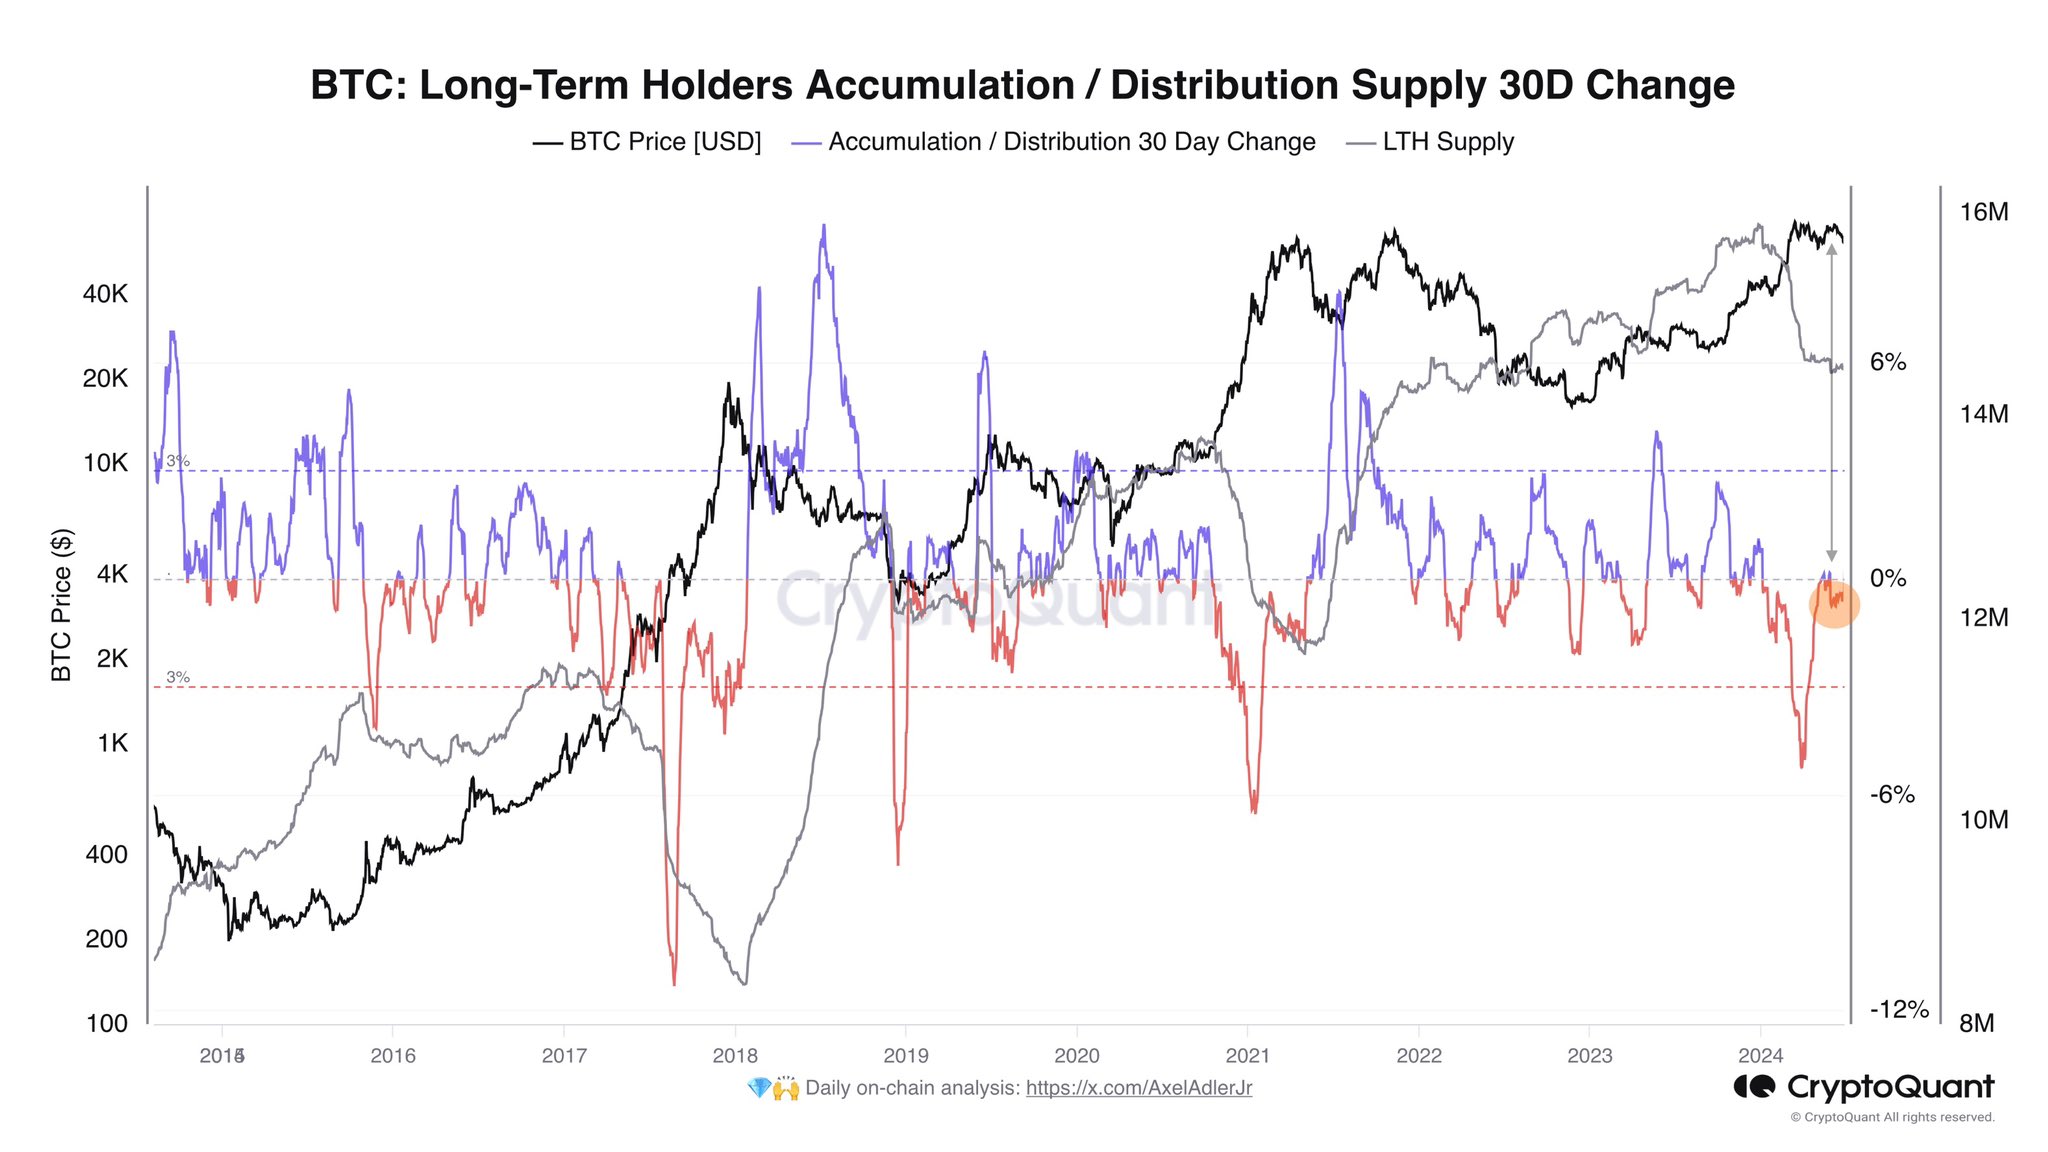
Despite their resilience, the Bitcoin LTHs have recently participated in a selloff. Below is a chart that shows the trend in the total supply held by these HODLers and its 30-day change over the past decade.
The value of the metric seems to have been negative in recent weeks | Source: @AxelAdlerJr on X
The above graph shows that the Bitcoin LTH Supply has been down since the spot exchange-traded funds (ETFs) received approval from the US Securities and Exchange Commission (SEC) in January.
From the chart of the 30-day change, it’s apparent that the plunge in the metric was the sharpest when the rally towards the new price all-time high (ATH) had occurred.
These diamond hands hold their coins for long periods and tend to accumulate large gains. The timing of the selloff would indicate that these profits had ballooned so much during the rally that even these diamond hands gave into the allure of profit-taking.
Despite the bearish price action the cryptocurrency has been going through recently, the indicator has continued to move down, although the decline has been much less steep.
The continued drawdown is even more interesting because the spot ETF approval launch is now older than 155 days. It would seem that whatever buying from the HODLers occurred back then is currently being negated by fresh selling from older cohort members.
Axel notes that the lack of growth in the LTH supply could imply the presence of market-wide pessimism. As the graph shows, this isn’t something new in this cycle.
It would appear that the Bitcoin LTHs also participated in selloffs in the middle of the last two bull runs. Thus, the recent distribution from the LTHs may not necessarily be a bad sign in the long term.
BTC Price
At the time of writing, Bitcoin is trading at around $61,200, down more than 4% over the past week.
Looks like the price of the coin has been going down over the last few days | Source: BTCUSD on TradingView
Featured image from Dall-E, CryptoQuant.com, chart from TradingView.com


